Nantes, 23 September 2022
pg_activity is a top like command line tool for PostgreSQL server activity monitoring.
The 3.0.0 version has just been released. It includes a new header, a few new parameters, bug fixes and the ability to use the tool without the SUPERUSER privilege.
Many thanks to all the contributors.
![]()
Hint message and debug information
pg_activity now displays hint messages when some information is not displayed
for one reason or another. The --debug-file option has also been added to
ease development, but remains unused as of now.
SUPERUSER is no longer required
The SUPERUSER is no longer required to use pg_activity. Please note that the information displayed will be limited to what the user is allowed to see in PostgreSQL.
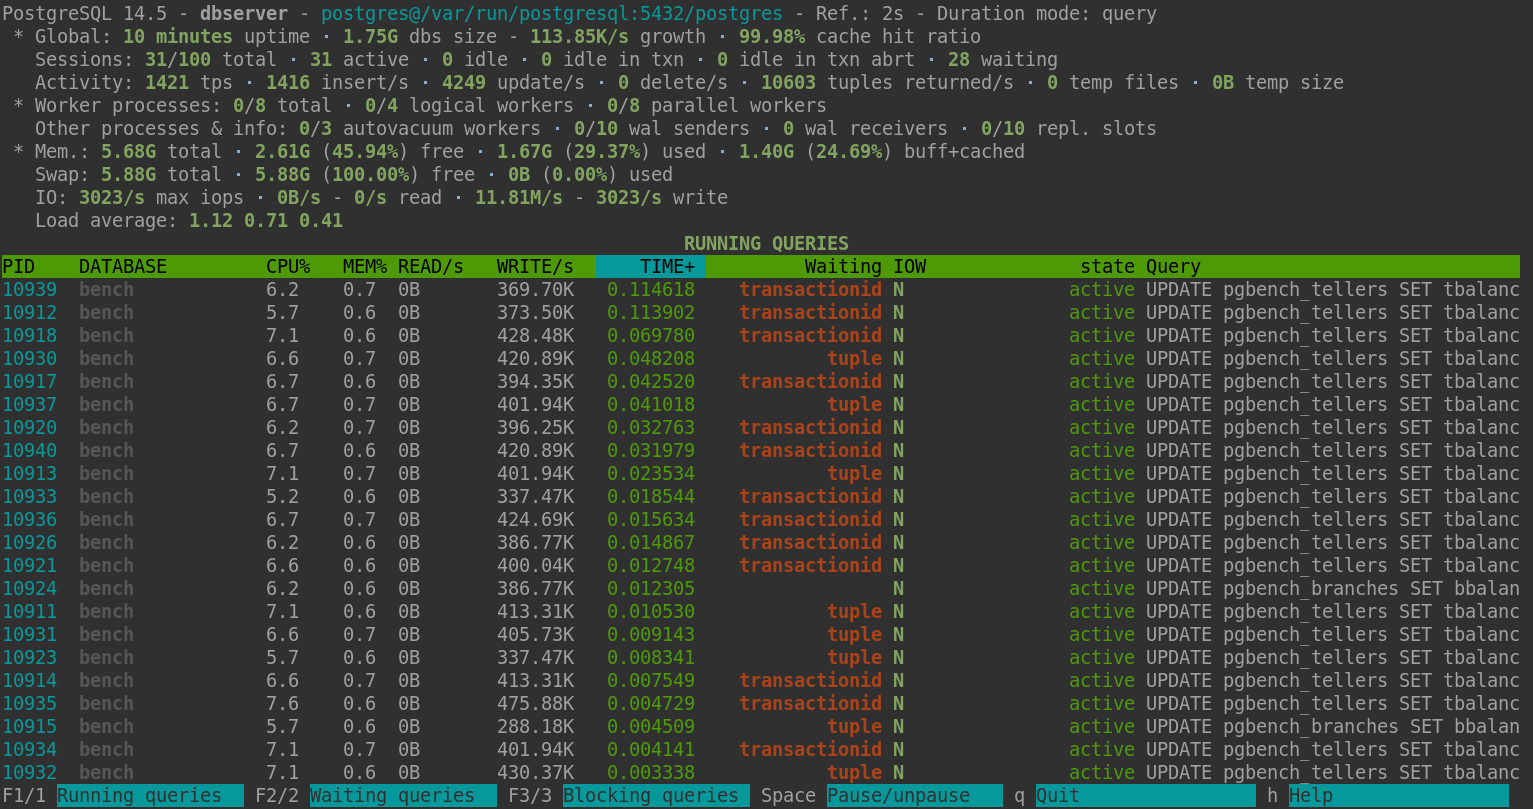
More information in the header
The header part of pg_activity as been extended to include more information.
PostgreSQL 14.5 - benoit-dalibo - postgres@/var/run/postgresql:5435/postgres - Ref.: 2s -
 * Global: 31 minutes uptime ⋅ 14.73G dbs size - 0B/s growth ⋅ - cache hit ratio
   Sessions: 2/100 total ⋅ 1 active ⋅ 1 idle ⋅ 0 idle in txn ⋅ 0 idle in txn abrt ⋅ 0 waiting
   Activity: 3 tps ⋅ 0 insert/s ⋅ 0 update/s ⋅ 0 delete/s ⋅ 0 tuples returned/s ⋅ 0 temp files ⋅ 0B temp size
The Global section displays general instance information. It gives an
overview of the activity and the temporary file usage in addition the
information provided previously. The database size and temporary file
information requires special privilege. If the requirements are not met, the
information will not be displayed. The temporary file query can be long if the
number of file is huge, therefore the query can be disabled at runtime if it
exceeds 400ms.
Two new options have been added to control the measures:
--no-tempfilescan be used to disable temporary file measures and is useful on RDS. It’s now included in the--rdsoption.--no-walreceivercan be used to disable WAL receiver query and is useful on Aurora where the feature is not implemented.
The visibility of this section can be changed with the i key or in the
command line with --no-inst-info.
 * Worker processes: 0/8 total ⋅ 0/4 logical workers ⋅ 0/8 parallel workers
   Other processes & info: 0/3 autovacuum workers ⋅ 0/10 wal senders ⋅ 0 wal receivers ⋅ 0/10
The Worker processes section displays the process count when it’s available.
The visibility of this section can be changed with the o key or in the
command line with --no-proc-info.
 * Mem.: 7.36G total ⋅ 3.00G (40.78%) free ⋅ 2.14G (29.05%) used ⋅ 2.22G (30.16%) buff+cached
   Swap: 15.03G total ⋅ 15.03G (100.00%) free ⋅ 0B (0.00%) used
   IO: 0/s max iops ⋅ 0B/s - 0/s read ⋅ 0B/s - 0/s write
   Load average: 0.15 0.22 0.23
The system section as been updated to give more information including both
sizes and percentages. This section requires access to the data_directory
GUC, the postamster.pid file and the stats themselves. They can be disabled.
The visibility of this section can be changed with the s key or in the
command line with --no-sys-info.
Other new command line options
The --refresh option can be used to configure the refresh rate from the
command line.
Documentation
The man page has been updated to describe all these changes and provides more general information.