Chambéry, 9 February 2021
The explain plan visualisation tool PEV2 evolved a lot in one year. Find out what’s new!
Already more than a year!
During the 2019’s fall, I presented you a new project. Behind the codename PEV2 was hiding a tool to visualize and interpret more easily the execution plans received from PostgreSQL with the EXPLAIN command.
This tool was initially developped with the goal to be integrated as simple visualizer embedded in other tools as an easy to integrate component.
Very enthousiastic about the potential of the project myself, I gave a quick presentation about it as a lightning talk a the PG Conf Europe (Milan, October 2019) and then also at the PGSessions (Paris, November 2019).
What was initialy only meant to be an updated version of PEV turned out to be useful and appreciated. Till then, the tool gained some intereting features.
Recent versions taken into account
With the continuous development of PostgreSQL, the content of execution plans evolves.
PEV2 makes sure to take the changes and new features into account.
Here are a few of them:
- information about parallelism and workers,
- new node types,
- plan structure changes (e.g. planning stats),
- new option WAL (added in PG13),
- etc.
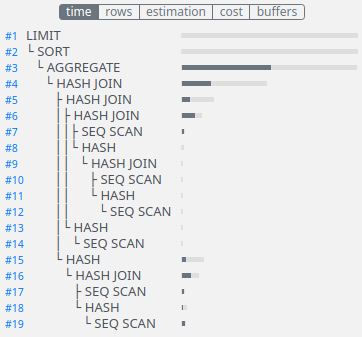
Diagram
Behind this weird name hides a feature which seems to win the votes of the users. This feature sets it apart from other tools like Depesz or PEV.
In the diagram, which displays on the left side of the screen, the info about nodes are shows with horizontal bars of different sizes. Everything is formatted in a table which makes it very easy to compare nodes with one another for numeric data.
In the example below, it is fairly easy to determine which nodes are lasting the most.
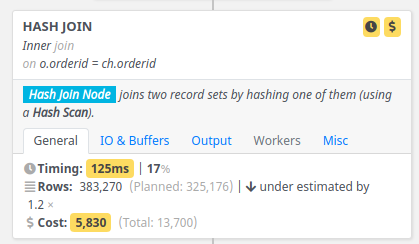
Organised presentation of info
The detailed data display for each node received a small facelift. The information are now organised in tabs. Which I hope is more clear and concise.
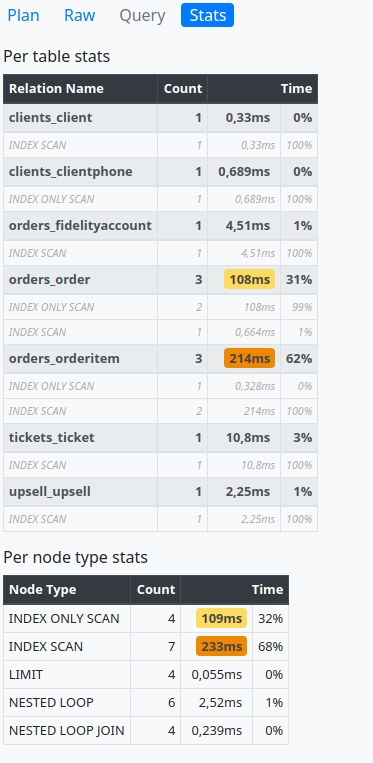
Global stats
In some cases, it can be useful to know how many nodes retrieved data from one given table. Or, one may want to have the list of indexes implied in the query.
The info is now gathered in a new “Stats” tab.
Direct link to a node
One of the last features added in PEV2 is relatively inconspicuous but may be
very useful too: selection and highlight of nodes has changed a bit.
You will now find an index number displayed for each node. This index can be clicked. It also selects the node in order to highlight it. For the main graphic as well as in the diagram.
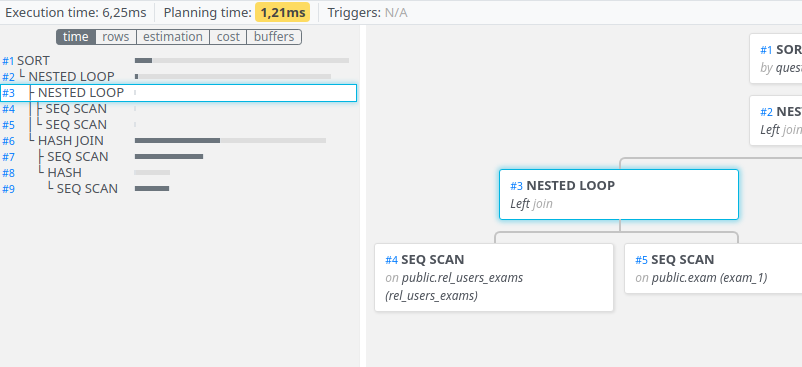
Another benefit that can be of interest if you want to share your plans and highlight a node in particular. By using the explain.dalibo.com service, you are now able to give your contacts a direct link to the node of your choice. By clicking on the link, the page will open with the node automatically selected and centered on the interface.
Here’s an example link: https://explain.dalibo.com/plan/hqD#/node/70
Test it yourself!
PEV2 used locally
Information that may have gone unnoticed: PEV2 can be used locally. No
need to use the service explain.dalibo.com.
We can imagine several cases in which it will be useful to you:
- the server you’re working on doesn’t have access to the internet,
- you are concerned that your sensitive data will be released,
- you wish to set up your own service.
To do so, you just need to get the pev2.tar.gz archive available for
download on the latest release page. Then you need to
simply extract this archive and open the file index.html in a
web browser and that’s it. You then have an application that works
entirely locally.
And as a reminder, there is everything you need to integrate it as a component in other tools (for supervision for example).
PEV2 lovers?
Are you a regular user of this tool? Do not hesitate to let us know. We take feedbacks. Testify!
How do you use it? Locally? Via explain.dalibo.com ?
And what do you think is missing? What could be improved?
Thanks
Not being a DBA myself, I regularly call upon my colleagues to help me understand the subtleties of the planner. And since explain.dalibo.com is a tool they use themselves on a daily basis to their consulting work, they are the first to give me feedback regarding the user interface or functionalities. When I don’t appoint them as guinea pigs to test new features I’m working on. ;-)
So I would like to thank them warmly.
Pierre Giraud is the creator and maintainer of PEV2, a Dalibo Labs project.