Paris, 6 September 2018
Our developers Julien Tachoires, Étienne Bersac and Pierre Giraud are releasing a new version (v2.0) of our favorite PostgreSQL management tool : temboard.
New feature : Alerting
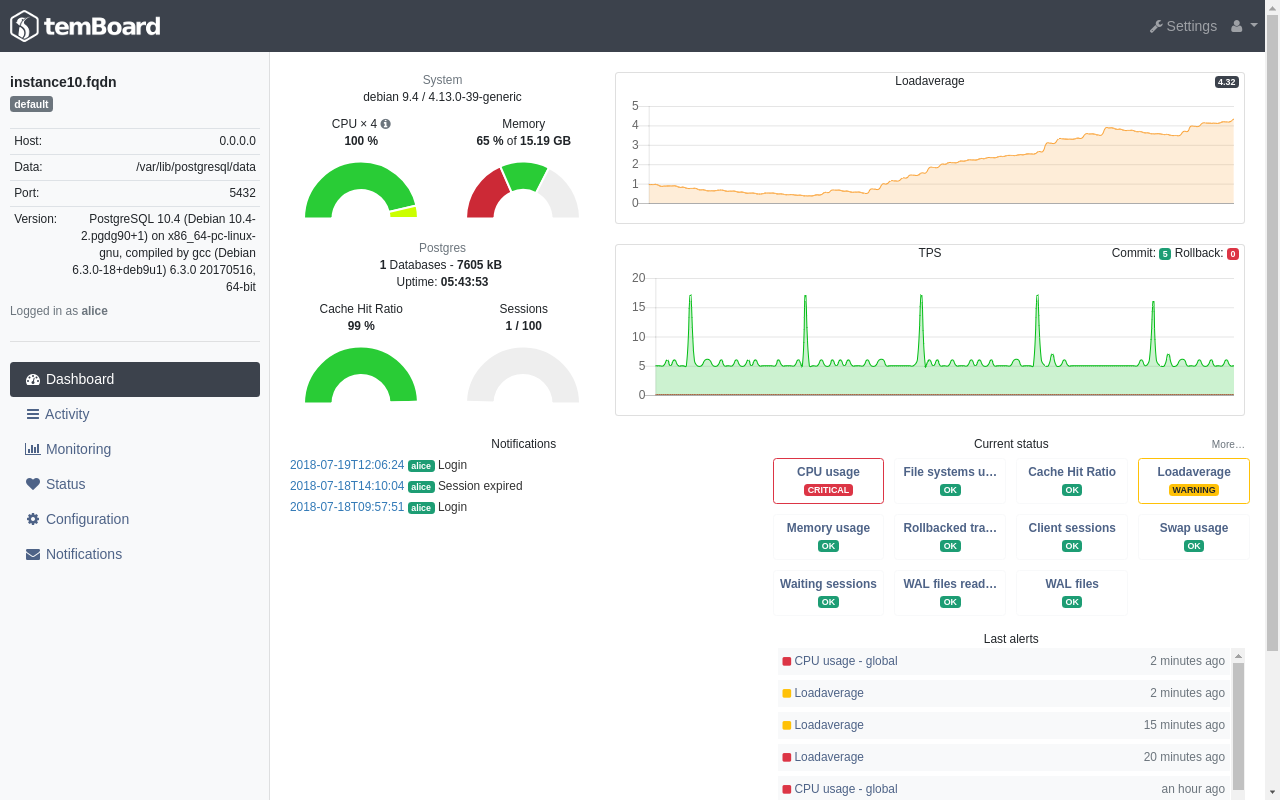
This new version includes alerting, a very awaited feature. Alerting is part of the monitoring plugin, it allows you to compare values for monitored metrics with warning or critical thresholds. It then allows users to get notified if something gets wrong on the Postgres instance.
When activated, alerting can show some information on the dashboard page. First of all, the current status for the different probes are displayed.

This new feature is accompagnied by some user interface improvements. A new status page gives a more detailed view on all monitored probes.
By clicking on probe name, one can also get access to an even more detailed view for each probe. In this view, users will find:
- the current status,
- the thresholds values over time,
- the values for the monitored probe over time,
- the past alerts (ie. status change),
- the time ranges for which the status was warning or critical or if the check was disabled.
Useful links
- Find the “How to Alerting” on the project’s ReadTheDocs page.
- Find the update tutorial to install temboard’s new version on the project’s ReadTheDocs page.
- Follow the project on Github and Twitter by following Dalibo Labs.
- PostgreSQL (471) ,
- temBoard (26) ,
- release (96) ,
- upgrade (43) ,
- management (18) ,
- alerting (17) ,
- Dalibo Labs (78)
